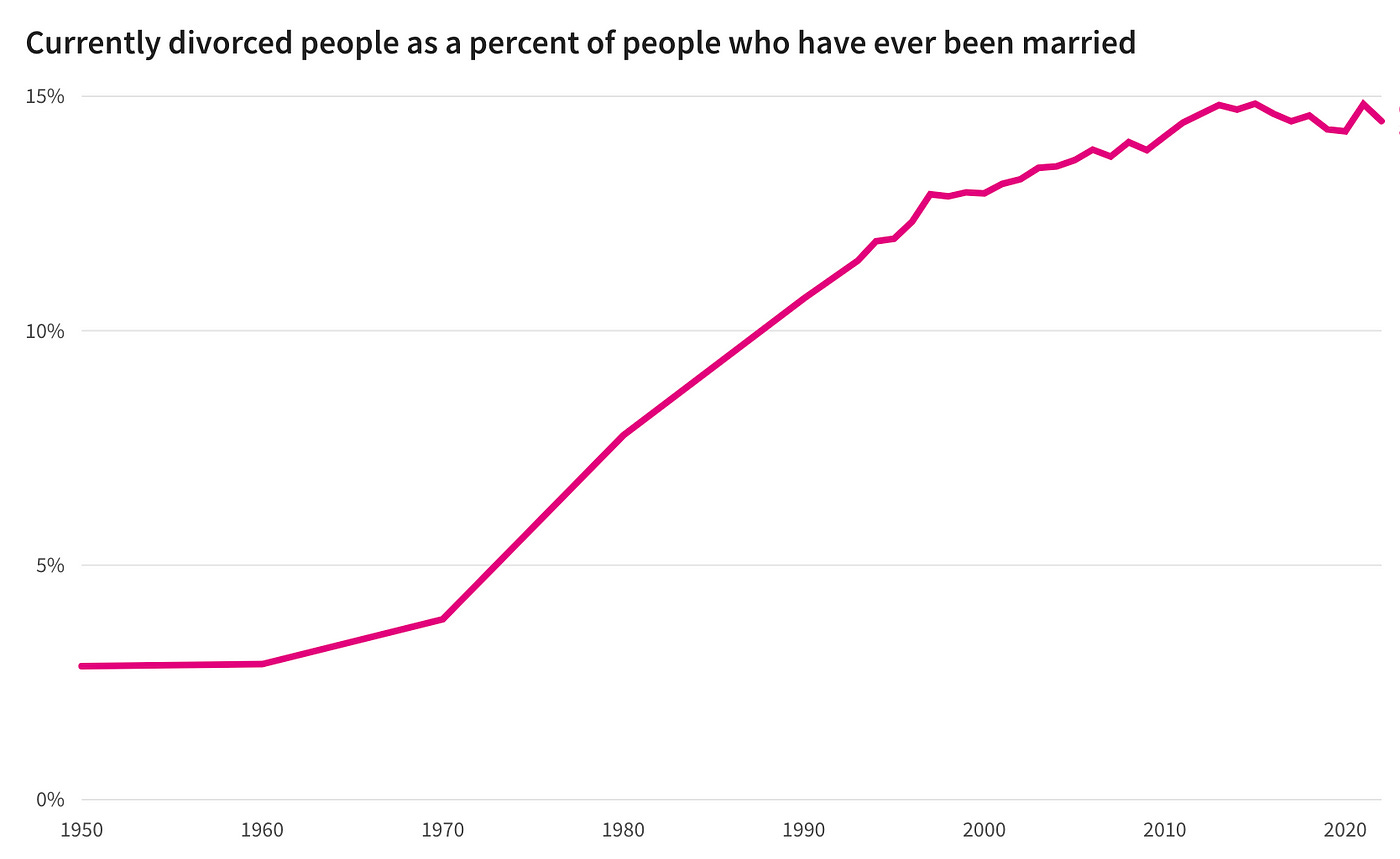
After a monthlong focus on weddings, I inevitably got curious about our hypothetical 1950s couple’s likelihood of divorce. I got married in 2023, and have heard my whole life that the divorce rate was 50%. Was a couple who married in 1954 as doomed as we are now?
This was originally published on Medium.
You’ve probably heard that half of all marriages end in divorce.
You might have assumed that means married couples have a 50/50 shot in making it to their goal of “forever.”
If this statistic has given you some heartburn, I have some good news. The divorce rate is not currently 50%, and has never been 50%.
Well… where does that number come from then?
How Divorce Rate is Calculated
There are several ways to look at divorce rate.
Divorced Individuals as a Percentage of Individuals Ever Married
One way is to compare the number of people who are currently divorced, and have not remarried, versus all people who have ever been married, including divorcees, and widows.

Crude Divorce Rate (CDR)- 2.7 divorces per 1000 people
We could also look at the divorce rate as number of divorces in a year divided by the average population, multiplied by 1000. This is called the crude divorce rate.
It’s used to broadly look at divorced rates in a population; it can be helpful to understand how divorce reflects social stress, and how it compares to the number of marriages taking place in a given year. It doesn’t, however, taken into consideration age, so the “average population” includes infants, the elderly, married people, people never married, etc.
In the US, both the marriage rate and the crude divorce rate have steadily fallen, until 2021.
Refined Divorce Rate (RDR)- 14.9 per 1000 married women
The refined divorce rate drills down to divorces per 1000 married women in a year. This let’s us filter out children and those who have never been married, and inherently compares marriages to divorces in a given year. However, this measure leaves out some same-sex couples and counts others doubly.
The Cohort Divorce Rate
This is where the 50% figure comes from, and it’s a projection, not a reflection of actual divorces happening in the US.
This rate is a sophisticated projection on how many couples from a specific cohort (age range) will get divorced in a certain time span. For Baby Boomers getting married in the 1970s, their projected divorce rate was in between 40–50%. Have they met this bleak, projected future? It’s still hard to say.
However, we do know that that in 2016, 34.9% of all divorces in the US were of couples ages 55+, almost doubling the rates that other age groups were getting divorced.
So in short… maybe?
The 1970s Divorce Boom
The divorce rate hovered around 2.5 per 1000 people in the US until the 1970s. Why?
There are lots of possible answers; the birth control pill became legal nationally in 1965, women started joining the labor force full time in higher numbers, and there’s one more thing that happened in 1970 that might have affected divorce rates in a big way-

In 1970, Ronald Reagan, then governor of California, signed the bill legalizing no-fault divorce, and the rest of the country followed swiftly. (Except New York, which started allowing no-fault divorces in 2010).
What is a no-fault divorce?
A no-fault divorce allows a married couple to file for divorce for any reason they’d like (this is where the oft quoted, “Irreconcilable differences” comes from.)
In absence of an option for no-fault divorces, married couples looking to separate, depending on the state they lived in, had to prove either:
Cruelty (abuse)
Abandonment
Infidelity
This meant that couples had to collect evidence and often testify against each other in court if they wanted to separate.
Especially in cases of abuse, you can see why this may have been a deterrent.
Who is more likely to get divorced?
If you’ve made it this far, you’re probably realizing that the reason a projected divorce rate is so variable is because there are outside factors that affect your likelihood of divorce. These factors include:
Education levels, with college graduates the least likely to divorce, high school drop outs the most likely.
Ethnicity, Asian-Americans are the least likely to get divorced.
Cohabitating tends to correlate with divorce, likely because religions that frown upon living together pre-marriage are likely not super keen on divorce.
Third marriages have the highest projected rate for divorce.
If your friends are getting divorced, your likelihood goes up as well.
If you you’re finishing this article and worry that your rate of divorce is higher than you’d like, remember that these numbers speak to trends; they don’t tell your future. Only you can do that!


